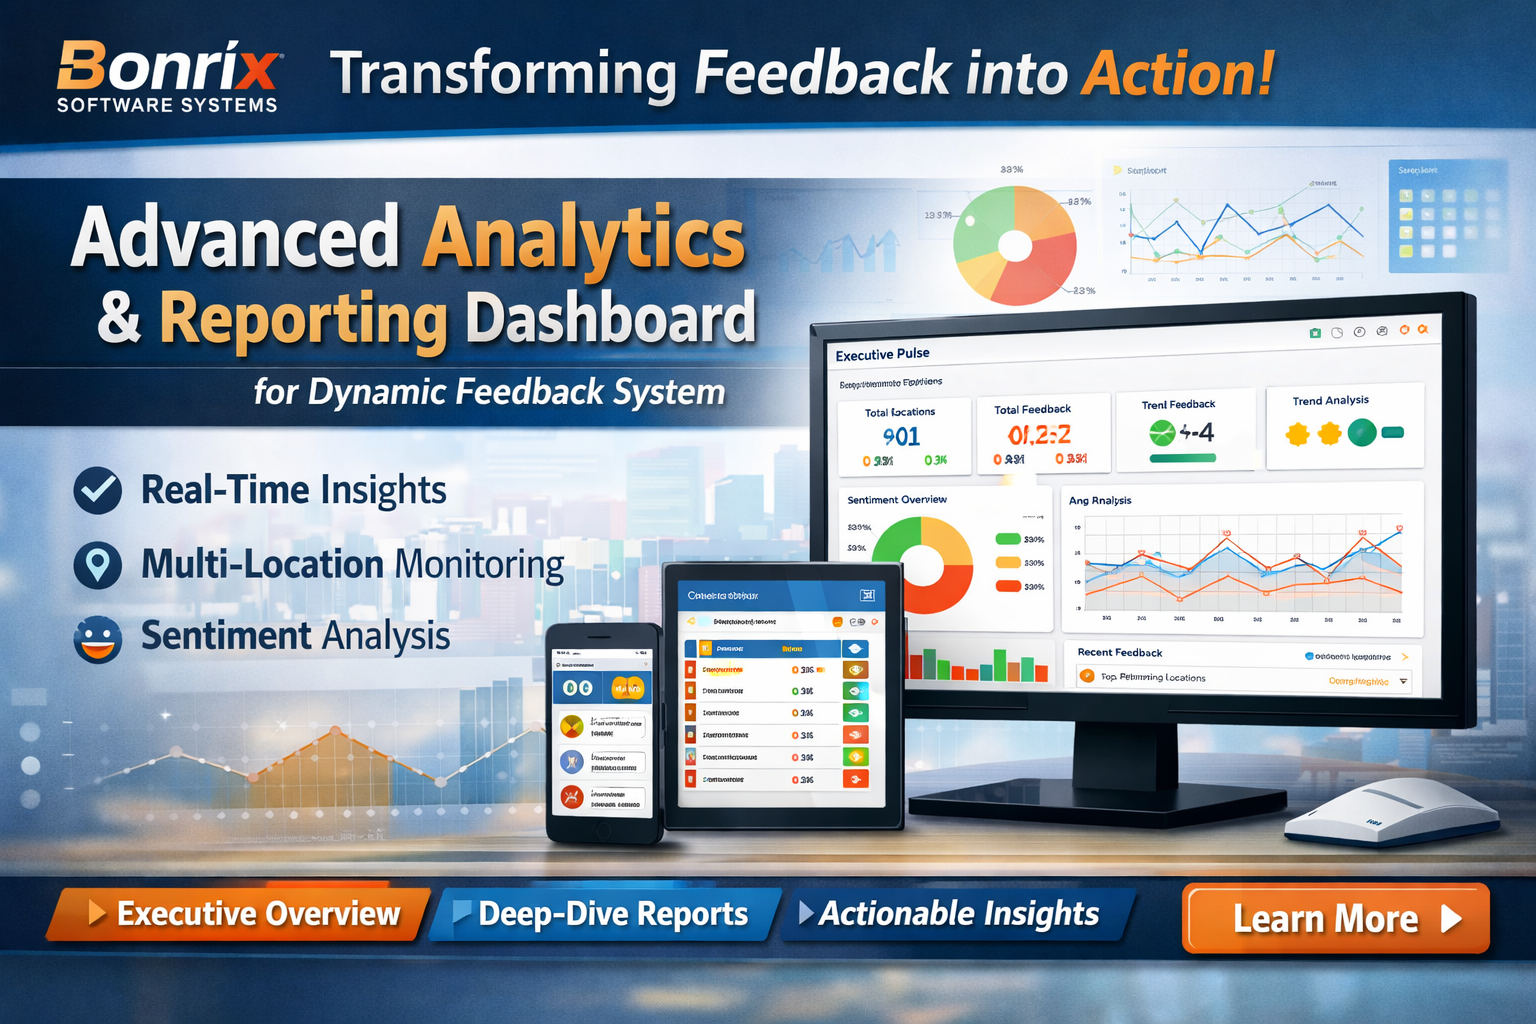
Transforming Feedback into Action: Bonrix Advanced Analytics & Reporting Dashboard for Dynamic Feedback System
Cloud-based intelligence for multi-location enterprises — Turn raw customer & patient feedback into real-time, actionable operational insights with Bonrix Dynamic Feedback Analytics.
🚀 Next-Generation Feedback Intelligence, Engineered in Ahmedabad
Bonrix Software Systems, headquartered in Ahmedabad, Gujarat (India), has officially launched a next-generation Analytics & Reporting Dashboard for its flagship Bonrix Dynamic Feedback System. Engineered for multi-location enterprises, healthcare networks, hospitality chains, and service-driven organizations, this cloud-based dashboard transforms raw customer and patient feedback into actionable, real-time operational intelligence.
🔹 Centralized Control & Holistic Visibility
Fragmented feedback data is a thing of the past. With a single manager access login, administrators gain a unified, bird's-eye view of responses across:
- 🏢 All company locations & branches
- 🏥 Departments & service zones (ICU, OPD, Lobby, etc.)
- 🚪 Individual rooms, counters, or touchpoints
The platform intelligently aggregates, compares, and visualizes performance metrics, enabling leadership to:
- ✅ Instantly benchmark sites against each other
- ✅ Identify top and underperforming locations
- ✅ Track sentiment trajectories across customizable time scales
🎯 The result: a wholesome, data-driven view of your entire operation.
🔹 Dashboard Architecture: Two-Tier Intelligence
1️⃣ Overview Dashboard (Executive Pulse)
The landing hub delivers instant operational clarity at a glance:
- Total Locations & Rooms: Live count of active sites and monitored zones
- Total Feedback & Average Rating: Cumulative response volume paired with weighted satisfaction score
- Recent Activity Log: Real-time streaming feed showing timestamps, locations, feedback types, and star/emoji ratings
2️⃣ Manager Feedback Dashboard (Deep-Dive Analytics)
Six purpose-built tabs empower managers with granular, decision-ready insights:
-
📊 Summary Tab:
Sentiment breakdowns (Happy/Neutral/Unhappy) with month-over-month variance, overall satisfaction scoring, emoticon-driven distribution charts, and automated location performance rankings. -
📍 Location View Tab:
Granular site-level tables mapping sentiment counts, response volumes, and individual scores, enhanced by scatter plots that correlate feedback volume with satisfaction levels. -
🏆 Top Performers Tab:
Automated leaderboards highlighting best-performing locations, complete with 30-day trending indicators to track upward or downward momentum. -
📈 Trends Tab:
Time-series analytics featuring monthly satisfaction trajectories, weekly feedback volume graphs, and sentiment fluctuation tracking across weeks/months. -
💬 Recent Feedback Tab:
Qualitative insight hub displaying individual emoji ratings alongside verbatim comments, with smart filters to isolate specific ratings (e.g., "Unhappy Only") for rapid grievance resolution. -
🗂️ Category Breakdown Tab:
Comparative radar charts and segmented sentiment bar graphs that benchmark departments, service categories, or location types against each other.
🔹 Intelligent Analytical Engine
What sets this dashboard apart is its Dynamic Logic Reporting. Unlike static surveys, the system adapts in real-time:
- 🔄 Deploys branching questions based on initial smiley selections to uncover the "why" behind every rating
- 🎚️ Multi-location & date-range filtering for precise comparative analysis
- 🏷️ Automated performance tagging (Good, Average, Needs Improvement)
This intelligence equips decision-makers with the precision needed to:
- ✅ Allocate resources where they matter most
- ✅ Standardize service quality across locations
- ✅ Drive continuous, measurable improvement
🌱 Why It Matters
The Bonrix Dynamic Feedback System's new analytics suite bridges the gap between customer/patient voice and operational execution. By delivering centralized, comparative, and time-scaled insights, organizations can:
- 🎯 Proactively address pain points before they escalate
- 🌟 Reward excellence and replicate best practices
- 📈 Elevate experience standards across every touchpoint
💡 Ideal For
- 🏥 Healthcare Networks & Hospitals (Patient Experience Monitoring)
- 🏨 Hospitality Chains & Hotels (Guest Satisfaction Tracking)
- 🛍️ Retail & Service Enterprises (Multi-Location CX Management)
- 🏢 Corporate Facilities & Office Campuses (Employee Feedback)
- 🚌 Transportation & Logistics (Service Quality Assurance)
🔗 Learn More
👉 Explore Bonrix Dynamic Feedback System Full Capabilities
📞 Contact Bonrix Software Systems
📍 Ahmedabad, Gujarat (India)
📱
💬 Get Demo on WhatsApp
📲 Call/WhatsApp:
+91 8153045500 /
+91 9429045500
🔗
Visit Bonrix Official Website